

Activités mathématiques en classe de seconde - 17. Représentation graphique de données
Editeur: T3 France
Editor: T3 France
Auteur: Jean-Baptiste Civet, Boris Hanus, Isabelle Pazé
Sujet: Mathematics
Activités mathématiques en classe de seconde - 18. Diagramme en boîte
Editeur: T3 France
Editor: T3 France
Auteur: Jean-Baptiste Civet, Boris Hanus, Isabelle Pazé
Sujet: Mathematics
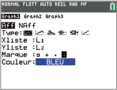
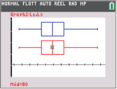
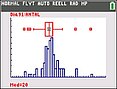
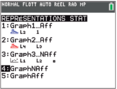
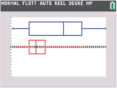
Jämföra tre provresultat | TI-84 Plus CE-T
Kurs 2 - I denna aktivitet tittar vi närmare på tre datamängder. Det handlar om provresultat för tre elever.
Editeur: Texas Instruments Sverige | Education Technology
Sujet: Mathematics

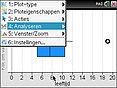
Roliga timmen - Utmaning - Tjuvar
Hur många tackor stals?
Editeur: Texas Instruments Sverige | Education Technology
Auteur: TI Sweden
Sujet: Mathematics
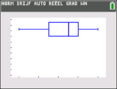
Kansrekenen en Statistiek: Boxplot
Editeur: WIL-de Wiskunde
Auteur: WIL-de Wiskunde
Sujet: Mathematics

Introducing boxplots and using them to compare very large data sets.
Editeur: Texas Instruments UK
Editor: Barrie Galpin
Auteur: Jay Timotheus
Sujet: Mathematics

Compare real data about the capacity of passenger lifts in the UK and EU
Editeur: Texas Instruments UK
Editor: Barrie Galpin
Sujet: Mathematics


Use your Nspire, effectively, to pick up extra marks in your GCSE or IGCSE exam.
Editeur: Texas Instruments UK
Editor: Barrie Galpin
Auteur: David Getling
Sujet: Mathematics